Welcome to my Q2 update & commentary on the CRE markets. As always - please read our general disclaimer here. This is not investing advice! Do you own research, and consult with a financial advisor.
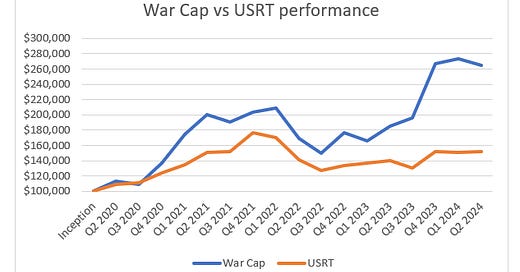
First, the returns. The fund is down -0.98% YTD, just beating out our benchmark USRT REIT index’s -1.19%. While I am pleased to beat our benchmark again, unfortunately we are below the S&P’s strong ~15% return ytd. This was not our best quarter but this is the nature of public investing, not every quarter is going to be a winner1 . However I believe this is partially a consequence of our very strong 2023, and ultimately I am happy to simply hang onto our massive gains from the last year. Obviously I want to outperform the S&P as well, but it is simply not realistic to do so every quarter - volatility is part of the game
Our long term performance since inception remains excellent at 164.8%, well above the USRT’s 51.46% return and the S&P’s 104.3%. I feel good about our portfolio and my estimations for its performance in either a low or high interest rate world, and I still see a lot of value and interesting opportunities in the public CRE markets.
Now to market commentary. As usual I’ll start with CRE in general, then cover general macro and then dive into sector specifics.
CRE Markets
Evidence is building we may be at a CRE market bottom in terms of private market pricing, unless a recession occurs. More on a potential recession later, but we have seen continued increased investor interest from some large players - in particular multifamily pricing has firmed up or increased depending on how you want to look at it. Notably KKR recently bought a huge $2 billion portfolio from Lennar at a ~5% cap rate, which is a very healthy price. The portfolio is newer and in high quality market, and at a minimum shows strong investor interest in newer higher quality assets. Add that to Blackstone’s Aimco take private offer in April and we had a very strong quarter for institutional multifamily allocation.
Aside from this pickup in large multi deals, investor interest in the other major asset classes seems about the same as Q1, which is to say improved over 2023 but not on fire by any means.
Another newsworthy occurrence in Q2 was SREIT (Starwood’s REIT) instituting an additional gate on redemptions. SREIT reduced the monthly redemption max from 2% to a mere .33%. SREIT was already facing redemptions over their 2% monthly maximum, so this maneuver dramatically limits liquidity for investors. This gate may cause some knock on panic in the non traded reit space, with more investors looking to redeem and get out.
The problem with SREIT, BREIT, & probably many other non traded reits, is they simply have not taken their lumps yet and marked down NAV to current market prices. Even the retail investors in these products are slowly realizing this, hence the continued desire for redemption.
On the lending side - rates remain elevated (obviously) which continues to be the major constraint on financing activity. Many lenders still remain on the sidelines as they attempt to reduce CRE exposure or work through duration imbalances. Still, overall CRE lending is slowly continuing to increase. The Fed released Q1 CRE mortgage loan data in June, which showed an ever so slight expansion from .7% growth in Q4 to .8% in Q1. Of this - multi grew at a much stronger clip than general commercial. I suspect Q2 will be similar to perhaps slightly higher again.
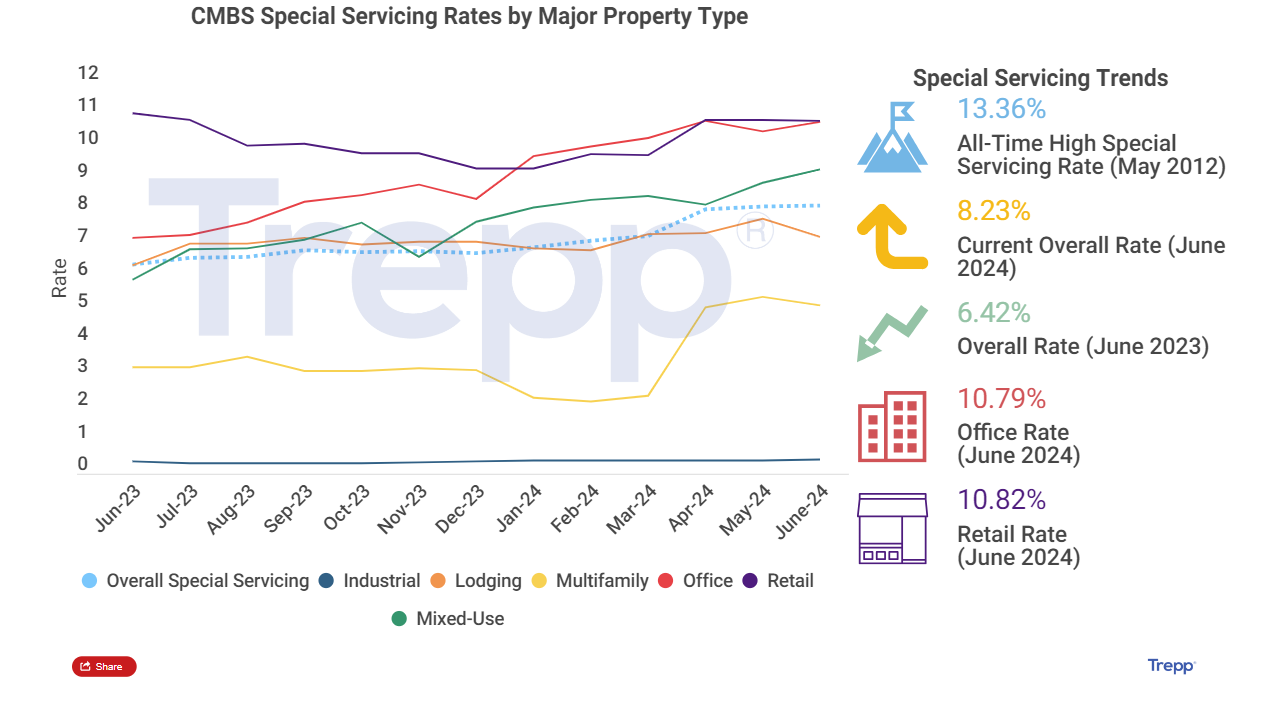
As I have said before though, commercial real estate moves slowly, and so we are still very much working through the classic symptoms of distress relating to the drop in prices which has already occurred. This is to say - even though prices may have stopped falling, and loan growth may be marginally positive, delinquency rates have continued to march higher & I fully expect them to go higher still. This can be seen in the CMBS’s delinquency data - according to Trepp the overall rate is up from 4.51% in December to 5.35% in June. As a reminder delinquency peaked in 2012 after the GFC! In fairness though as relates to delinquency rates here, this is in large part driven by ongoing significant office defaults, which arguably are as much a secular trend as they are cyclical. Still - if you look at special servicing rates we also see increases in other asset classes outside of office, which will likely lead to future increases in delinquency rates.2
Special servicing rate data from CRE data provider Trepp.
Overall - despite the current turbulence I feel quite good about the medium to long term prospects for the CRE markets. Replacements costs have increased dramatically, and pricing is back to 2019 levels for many asset classes. I am confident prices will rise above replacement for assets with good demand, as this is necessary to justify meaningful new construction. As to whether this will be driven by falling cap rates, rising incomes, or a bit of both, it is harder to say. I would wager falling cap rates have a meaningful role to play given recent favorable inflation data, but I’m only ~65% confident in that. This segues nicely into a discussion of the general economic picture.
General Economy
On the macro side, as relates to CRE the biggest news has again been inflation. And that news has been very good lately.
After hot readings in Jan & Feb, inflation has come back down and the latest PCE data for May came in very mild. Here is the nice summary table from the always excellent Jason Furman (follow him on Twitter @Jasonfurman).
Overall 12 month PCE is at 2.6%, and really almost all of the excess in inflation is due to housing. Ex housing we are at 2% for 12 months, 2.2% for 3 and 2.8% for 6 months.
And the latest PCI which just dropped July 11th is even better. PCE is the fed’s favored metric, but some of PCI feeds into PCE and this report was very good. Here is the same PCE chart for CPI (also done by Furman).
First - we saw actual deflation MoM! But what is really notable in my view is that housing has finally begun to decline in a meaningful way - something that was pretty clearly going to happen given what we saw in private rental data, but was taking seemingly forever to actually occur in the government data.
Another chart from the excellent economist Jason Furman
As inflation ex-shelter has been sub 2% for over a year now, housing really has been the last thing holding up the official numbers. So if housing continues it’s decline (which again the private sector data says it will), the headline numbers should continue to drop. Other worrisome categories, notably insurance, have also cooled dramatically as I suspected they would given the slowdown in the private data.
As I suspected - the hot winter look more like noise than trend right now. That said I would wager the fed will want to see another month or two of good data before actually cutting though - the market consensus for a September cut being in play feels about right.
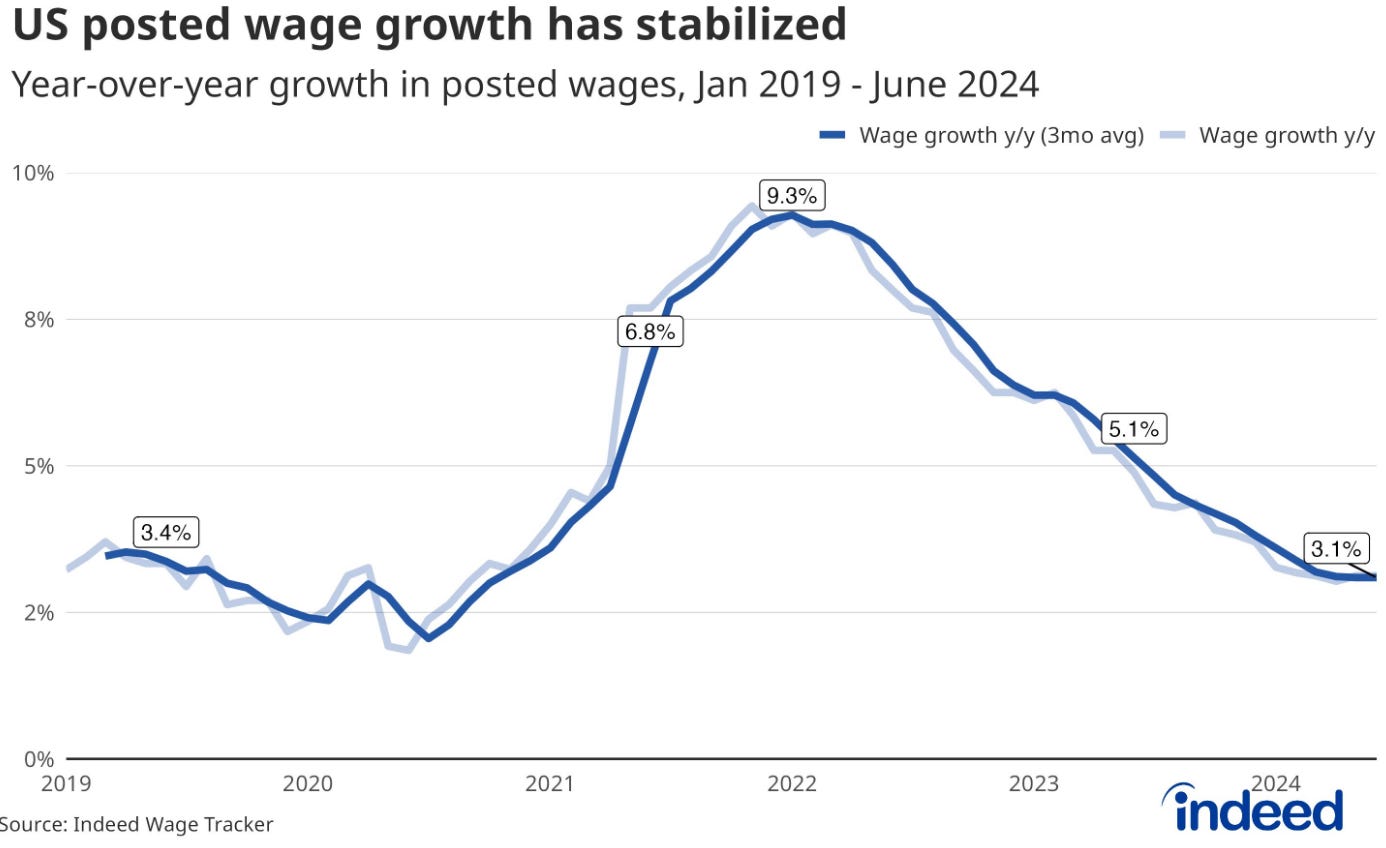
Perhaps even more importantly, wage growth has also declined dramatically, and thankfully seems to have leveled off at a healthy level rather than continuing its precipitous drop.
According to the Indeed wage tracker, which I like as it appears to be more of a leading indicator relative to the government data (which is very much lagging), we have leveled out around 3% wage growth, which is actually below pre-covid levels.
After the winter scare, there seems to be little evidence that inflation is reaccelerating, and it looks to be continuing to decline. This gives me a good deal of confidence rates are coming down, although the pace is hard to predict.
My worry frankly is now more towards the other side of the equation, that the Fed may keep rates too high for too long and that we may be getting close to tipping into a recession.
The most recent jobs report from July 5th is very interesting. Many elements of these reports are a bit unreliable in the short run in my view due to the significant revisions we see months and years after the fact, but some of the more immediately useful data relates to unemployment. We have great data on # of unemployed, although the definition of the labor force is a bit fuzzier.
What is a bit concerning is the continued rise in total number of unemployed over time. The total number of unemployed in the US is now 6.8mm, up from a low of ~5.7 in late 22 / early 23. That is a 19.5% increase. For comparison, in the 2000 recession we went from a low of 5.48mm unemployed to 6.14mm by the official start of recession in March of 2001, only a ~12% increase.
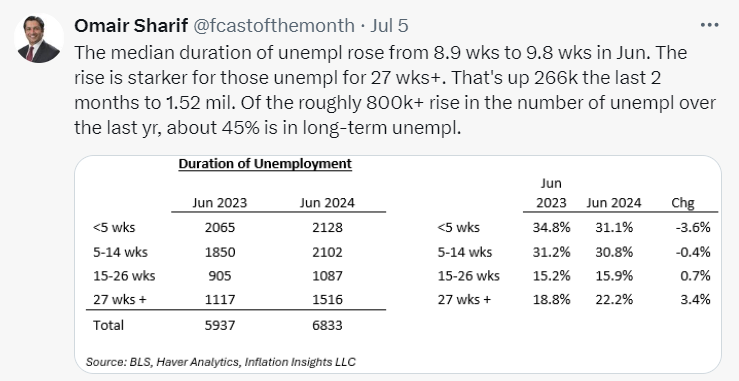
The number of long term unemployed is also up a good bit - here is a nice breakdown of unemployment by duration by economist Omair Sharif (also worth a follow on Twitter).
And finally, the unemployment rate has continued to tick up, rising to 4.05% in June. While in absolute and historical terms this is still quite low, it is up from a low of 3.5%. Historically when unemployment rate averaged over 3 months has risen .5% from the cycle low, we have entered a recession. This is called the Sahm rule, and using 3 month averages we are at .4% - if the rate stays where we are for the next 2 months we will be right on the edge of passing the .5% threshold (3.6% being the 3m average low). One thing to note here is that we are at historically low unemployment rates so there is a very limited sample size of previous similar conditions to draw upon when analyzing this data, but it is concerning nonetheless.
At a minimum these data show further slowing in the job market, and given how this kind of slowdown can snowball it has me worried we could be getting close to a recession3.
What is extremely weird about this cycle, at least in CRE, is even if I know with perfect clarity that a recession was occurring I’m honestly not sure what would happen to CRE prices. Usually a recession means prices decline, as lending freezes up, capital becomes scarce, and incomes decline. However we are already sitting on significant price declines triggered by the rise in rates (and some operating softness in certain assets/geographies), and if we really do have a recession, assuming it is mild, the decline in rates which would come with it may well offset declines on the income side of the ledger, or perhaps even outweigh the income changes!
The big question will be what happens to capital and lending – both have already been quite constrained for the last ~year and a half now. I am honestly not sure, as lenders have been working through their risky and bad loan books now for quite some time, and many are likely actually in pretty good shape (big multi bridge lenders aside). My bias is that capital would probably still become a bit more constrained, leading to a further price decline, but I’d guess this would be mild and I am not terribly confident of that prediction.
I would wager though that if we do see a recession the general stock market will perform pretty poorly, and I think CRE is very likely to outperform in this scenario given its recent underperformance relative to other asset classes.
Of course, a recession may well not occur and we might actually just be pulling off the mythical soft landing. Thankfully for our portfolio we are pretty well positioned either way - I think only slight further price declines in a recession (if any), and we should see good income growth in a new growth cycle. The reason for this is ultimately simple - we are buying quality assets with good demand profiles well below replacement cost.
Onward to the sector specific commentary. Same as last time, as these letters are running long to split this up I will share 1 sector here as a preview, with the balance to come in a week or so.
Multifamily
Lets start on a positive note with multifamily. The multi REITs have done fairly well in 2024, driven by what was in my view overly cheap pricing relative to the private market, which itself seems to have improved a bit. Blackstone’s AIRC deal combined with a number of large private trades (see KKR’s $2b trade from earlier), and firming up operating fundamentals have all supported higher multi REIT pricing. Still even with the rally many multi REITs are still trading at a bit of discount to NAV. Take bellwether EQR - despite its 10%+ rally this year, it still trades at a high 5s cap rate, a decent spread to its likely low 5s cap rate portfolio value. And this compares very nicely to KKR’s $2B 5% yield deal.4 Against all of this, multi has been one of our strongest performers this year as well, with fund holding NXRT up over 11% YTD (over 18% as of this writing!).
While the capital markets are showing some strength, the leasing markets continue to be weak. The story remains one of good demand overwhelmed by huge supply, particularly in the sunbelt.5
But there are signs of life - there has been some pickup from Q1 especially in coastal markets. You can see this ongoing geographic dispersion in the REIT Q1 data - lets use EQR as an example. As you can see below, the coastal markets are squeaking out gains on a blended basis, but new rents are still down slightly, while Denver and the expansion markets, which are basically Atlanta, DFW & a bit of Austin, are firmly negative.
EQR Q1 leasing data
Sunbelt focused Camden is worse - here are their new lease rates from their Q1 earnings call in early May.
Now as Camden notes, preliminarily Q2 appears to be a bit better than Q1 (there is some seasonality to this too). In particular some of the hard hit west coast markets look to be showing some signs of strength. Here is commentary from EQR at NAREIT in June about some of the tech markets beginning to show some life.
Some of this frankly is related to quality of life issues that were specific to these markets, which are partially receding. Seattle elected 5 new city councilors (out of 9), and the new council is much more moderate and seemingly quality of life oriented. The recent supreme court ruling on homeless encampments also will give cities legal cover to clear up long standing homeless camps, and I suspect many will do so if they have not done so already.6
The other side of this pickup is likely simply the cessation of tech layoffs - it is hard for an apartment market to show real strength when the biggest employers in a market are conducting layoffs (as was the case in 22/23 for the mega tech firms). Now that the layoffs have (mostly) stopped, this ought to help the SF/Seattle markets to return to growth.
Given the continued dominance of tech firms & their ability to generate massive amounts of wealth, the pendulum may be swinging back to west coast fundamental outperformance due to limited supply and strong income growth (which has been the case for the past ~20 years).7
Overall the apartment market will likely remain soft for the balance of 2024 into 2025, and then pickup strength when the current supply wave recedes later in 2025. This is mostly the same story as Q1, the main difference is large investors are beginning to deploy capital in front of the trend.
Fin
That is it for this letter - thank you for reading and I will share the balance of the sector commentary in another week or so.
Q3 is off to a good start though, as of this writing we have swung to a ~4.74% positive return. Got to love the public market volatility!
For those who do not know, special servicing rate is a broader category of distress than delinquency. Loans will transfer to special before they go delinquent, and it can be viewed as a leading indicator of delinquency rates, although not always - large loans can transfer idiosyncratically to special then resolve without defaulting.
Or conceivably are already in one, albeit a minor one. Jobs data undergoes significant revisions over time & the start of a recession is usually declared well after it already began. Again in 2001 March was the official start date but it wasn’t declared so until November. See my prior commentary on rolling recessions - tech & the coasts started us off in 22/23, and have now begun to recover & now the sunbelt has begun to soften (FL in particular).
One interesting thing I am seeing in the multi space is the widening spread of cap rates between A & C assets. This is a return to normalcy in my view given the often hugely disparate capex profiles of these assets - the very tight spreads we saw during the frothy years were I believe an anomaly. In fairness some of said tight spread was driven by the real opportunity to upgrade C’s into B’s at reasonable cost, but that opportunity set is mostly played out, and now moving forward I expect to see a wider A/C spread.
I do think there is some risk here if we have a proper recession these sunbelt markets get could really ugly as falling demand meets the current supply wave.
I am not going to get into the moral implications of all this, I intend to keep this letter firmly focused on investing. And the reality is for a multifamily owner a nearby homeless encampment is a negative as people do not want to live near that. Clearing these up improves desirability and demand in surrounding areas, which will benefit many west coast metros who had outsized homeless populations.
One fly in the ointment here is political risk - these markets are still at relatively high risk of tax increases, rent control, and now with the rise of the YIMBY movement, potential reduction in supply barriers. I’m still somewhat skeptical the YIMBYs will be able to meaningfully increase new construction but they have been gaining steam recently.


Great note, as ever.