For now I’ve decided to continue sharing my quarterly letters here on Substack. Also this quarter I’m going to try something a little different, which is I’m going to split up this letter into two parts. The first part here will cover some commentary on the overall CRE markets & macro economy, and a bit of sector focus. The second letter will finish up the sector specific commentary. These letters are starting to run a bit long, and so I decided to experiment with breaking it up to make each piece a bit more digestible. Hopefully this makes the letters easier to consume and also increases engagement. As always - please read our general disclaimer here. This is not investing advice! Do you own research, and consult with a financial advisor.
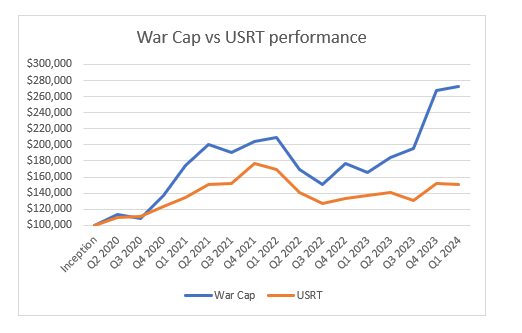
First, the returns. War Cap was up 2.17% through the end of Q1, compared to -0.72% for the USRT index and 10.79% for the S&P. I am pleased we were able to continue to outperform our real estate index. Of course I’d also like to beat the S&P - but you can’t win every quarter, especially one where Nvidia is up nearly 90% YTD...
I actually feel especially good about our performance this quarter in light of our phenomenal year end last year, being able to hold onto those strong gains is a good thing.
Our long term outperformance is clearly visible in our returns since inception in 2020, at 172.82%, compared to 51.29% for the USRT & 95.41% for the S&P, even with the recent tech rally.
I continue to feel good about our portfolio - we own very high quality assets at yields significantly above private market yields, & at prices well below private market and also replacement cost.
Now the broader economy is another question.
First I’ll discuss the general CRE markets a bit, then overall macro, and then dive into CRE sector specifics.
Private market CRE prices may have bottomed out, or at least prices have stopped declining for now. Here is Green Street’s commercial property index showing values over time.
If I had to wager I’d guess we are either at or close to the bottom in terms of private market CRE pricing, and many large investors feel the same way.
The largest CRE investor, Blackstone, is aggressively moving off the sidelines - here is Gray talking about real estate on their Q4 call.
It certainly doesn’t hurt that BREIT finally was able to meet redemption requests for the first time since 2022.
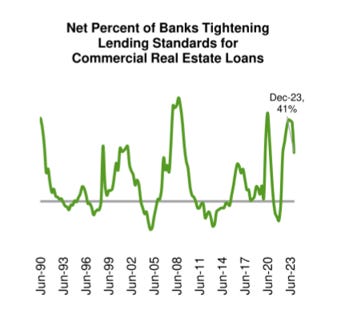
Lending however remains more constrained, as many large lenders continue to work through problematic loans. That said, at least on the banking side it looks like we are past the worst of it and conditions are beginning to loosen. Here is another Green Street chart which tracks the share of banks tightening or loosening CRE loan standards.
I don’t think this cycle is going to be ‘typical’ because it is the first to involve higher rates in many decades, but it certainly looks like in another year that bank lending for CRE will be a good bit more available at the current trendline. I’d guess the balance sheet constraints are mostly gone by then and at which point it is going to be a value/DSCR issue.
Historically these two factors combined (increasing investor and lender interest in CRE), has lead to CRE bull markets, and if we can avoid a big national recession I expect the same to occur here in the next few years.
All is obviously not all roses in the CRE world - the price declines may be over1, but we are very much still dealing with distress coming through the system. CRE distress is always slow to manifest, as it takes awhile for physical property performance to deteriorate, and then it takes another 6-18 months for a lender to accept reality and either foreclose, sell the loan, or modify it.
In the public space these struggles are evident in many places, one of which is the CRE mortgage REITs. These are almost all bridge lenders, which means they typically make higher LTV/lower DSCR loans on transitional properties. As you can imagine, this is a risky place to be in a downturn, as these are the first loans to suffer losses.
Several prominent short sellers have come out with short reports on a couple of these firms over the last several months. The quality on some of these reports was shockingly low, but I think in general they have a point. The difficulty here is that the balance sheets are black boxes2, and asset price declines are at a level so as to be right at the edge of where you might see loan losses.
So - if the lender did a good job, I could see a world in which losses are manageable. However if they made a bunch of bad loans (or even just a few really bad ones), losses could be quite severe.
Thus far, losses have been fairly manageable, but we are nowhere near out of the woods yet and it wouldn’t surprise me if at least one of these firms has some fairly bad losses.
Overall - sentiment in the CRE capital markets seems to be improving, and this should be broadly supportive of prices moving forward I believe in either a high or low inflation scenario. If inflation remains high, income growth should pick up / stay strong (depending on asset class), and if it falls we will likely see some cap rate compression. Speaking of inflation -
General US Economy
Looking at the economy more broadly, the biggest macroeconomic story of the quarter, at least from a CRE perspective, has been the stronger January and February inflation readings.
January core PCE came in hot at 5.1% MoM, however February cooled off a bit with core at 3.2% MoM.
As per usual here is the latest, courtesy of economist Jason Furman over on Twitter.
Encouragingly, Core services ex housing was only 2.2% in February - this is the closest thing to a ‘wages’ proxy that the PCE has.3
These hotter readings have tempered expectations of quick fed rate cuts, and the 10 year is now back above 4.3%. I am cautiously optimistic March’s data will look better & that January’s hot reading was more noise than trend, but we shall see.
There is a theory floating around that the hotter January / February numbers are being driven by exaggerated beginning of year seasonality. The idea is that most firms raise prices at the beginning of the year, as many items at priced on an annual basis. The BEA of course corrects for this with seasonality adjustments, however these adjustments are based on historical data, and so if the price increases are higher than normal, it may overwhelm the seasonal adjustments.
In a world where we just saw a large bout of inflation, it is not unreasonable to think that many firms are still playing catchup on their pricing, and thus are doing larger than average annual increases still. This may be what caused a strong January reading.
Beyond this theorycrafting, there is some data to support continued (healthy) softening in the economy.
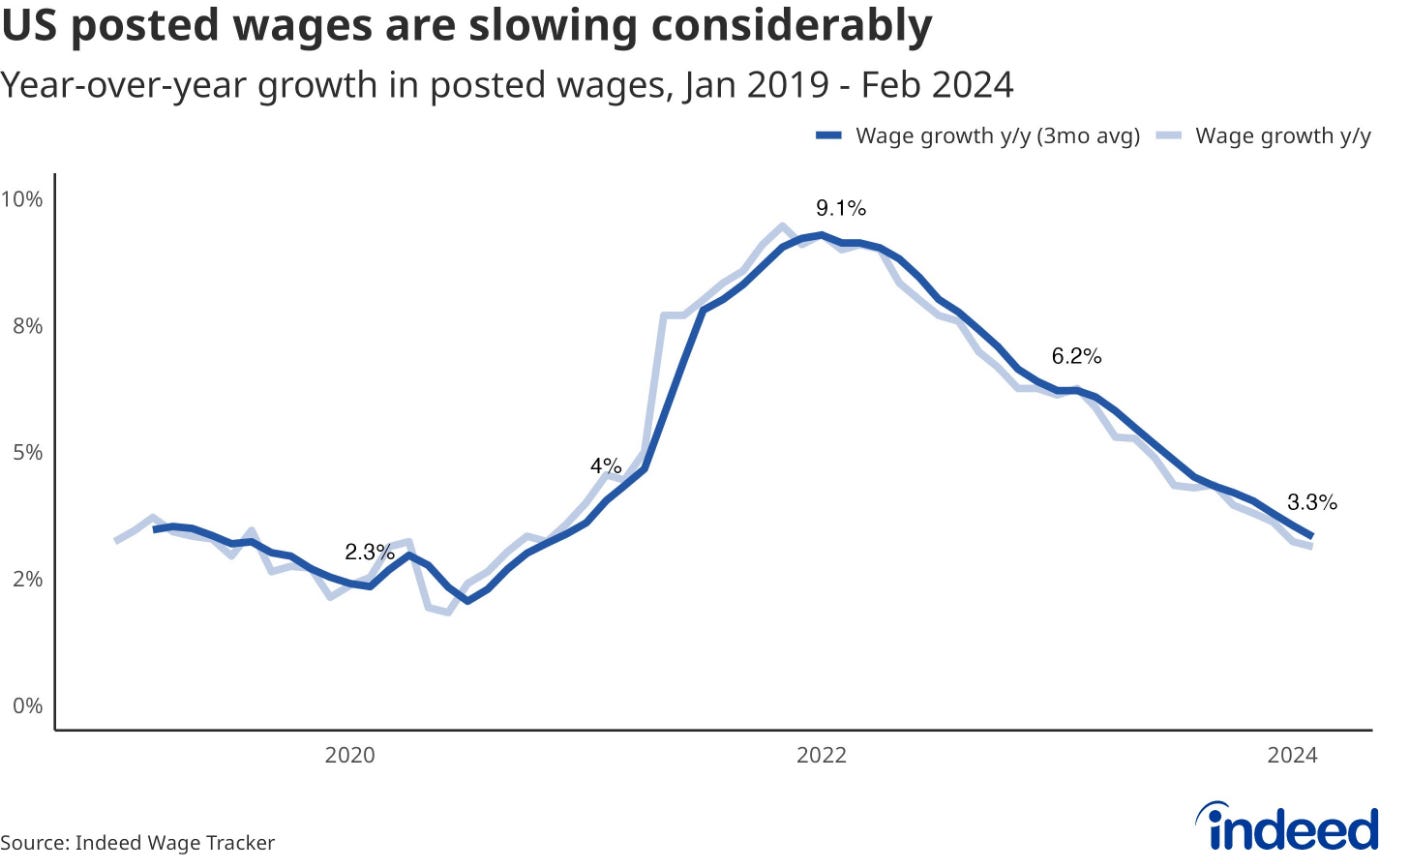
Indeed publishes a really nice data set on new job wages I believe I’ve mentioned here before. This data continues to show steady softening, with YoY growth down to 3.3% in February.
The reading was 3.6% in January, so at the current pace, new wage growth would be below the 2019 average of 3.1% potentially by next month!
The reason I like this dataset as it appears to be a leading indicator (which makes sense as it is focused on new jobs). Here is the same data compared against the popular Atlanta Fed wage tracker.
The two have generally moved in tandem, just with a significant delay for the Fed data. So it will be very interesting to see if wage growth does indeed cool off later this year, or if something is driving a divergence between the data. The Indeed dataset is relatively newer, so we don’t have many years of history to review for it.
Overall though right now I don’t have a lot of confidence either way as to whether the economy is continuing to soften with declining inflation (and even a potential recession), up ahead, or we are seeing a reacceleration of inflation.
It may be we continue with the theme of rolling or regional recessions - tech and coastal markets had a pretty rough 2022/20234, and now seem to be recovering thanks to a strong rally in tech stocks and continued strong earnings growth - not to mention the whole AI thing.5 Now the sunbelt and Covid growth markets continue to be having a rough time as some of the prior coastal weakness, combined with large oversupply in certain asset classes, spreads inland.
It is also worth noting that the sunbelt draws much of its economic growth from coastal relocations, both on an individual and corporate basis. The sunbelt may be facing multiple headwinds here as relates to this growth engine. The first is that Covid may simply have pulled forward a lot of latent relocation demand, and thus we are now in the hangover stage and it may take a few years for relocation demand to recover.
The second issue is that with coastal prices flat to down and sunbelt prices (both for sale and for rent) massively up over the last few years, the affordability gap that drove many of the relocations is much lower than it has been historically.
Here is a rough comparison of home prices in NYC vs Austin and Atlanta in 2010 vs today ( I couldn’t find a single data source for each metro/time so this is inexact but you get the idea).
Atlanta used to be 75% cheaper than NYC, and Austin 50% - now Atlanta is 50% cheaper and Austin only 22%! The cost of living incentive to leave is clearly a lot lower. 6
People talk about taxes and business friendly climates as the reason for moving, but in my view housing affordability seems to be a very important driver. After all - many of the supposedly low tax sunbelt states actually have pretty healthy income tax rates, but that hasn’t stopped them from benefitting from coastal relocations (only TN, FL & TX have no income tax).
If I had to guess, I’d wager what happens here is the coastal markets re-accelerate, while sunbelt is flat for awhile which brings us back into the historical equilibrium in a few years. But who knows, perhaps the affordability gap becomes narrower still!
Coming back to the broader economy - as usual I don’t have a strong confidence level in where rates and the economy are going to be in 6-12 months. The range of outcomes frankly feels quite wide. On balance the economy looks fairly healthy, with both pockets of strength / overheating and pockets of weakness. Again luckily for us on a longer time horizon I am confident high quality property with good demand profiles will perform well in a high or low inflation environment.
I probably sound like a broken record here but it is worth repeating - in a high inflation world, real estate prices generally increase in line with inflation driven by increasing incomes (or the potential thereof). These increases are further supported by increasing replacement cost as construction costs rise with (or even faster than) inflation.
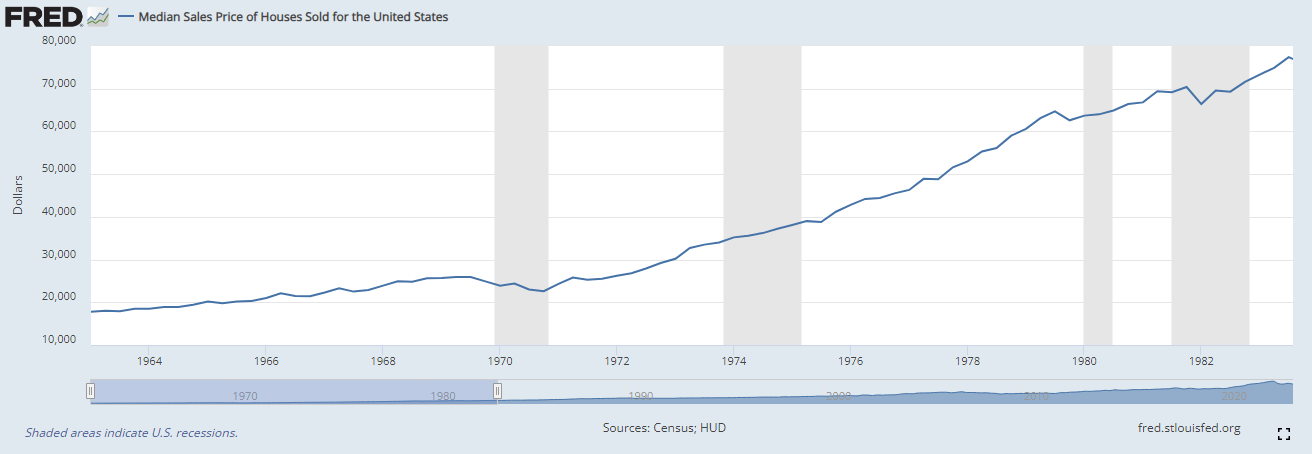
Just look back at our last inflationary environment - median US home prices just about quadrupled in 20 years!
And of course if inflation stays low and rates fall, that will likely drive some cap rate compression. The cap rate re-rating (aka significant increase) is I believe broadly behind us, barring a massive spike in inflation from here. So what we now face is really a win/win situation for real estate.7 However public markets continue to seem to act like inflation is disastrous for real estate, especially levered firms. Really it is the opposite - if inflation runs hot that would be good for highly levered real estate firms. The real value of their debt would be inflated away!
The dangerous part is when rates rise quickly like we just saw, and financial conditions change much faster than on the ground incomes. But so long as we don’t have another rapid increase in rates, things should be looking fairly good for CRE.
Anyway that is enough macro tea leaf reading, lets move on to the real estate sector specifics.
Residential: We’ll start with residential, everyone’s favorite & most personally relevant sector.
Generally the overall multifamily market remains soft, but the regional dispersion is becoming significant. Coastal markets are strongly outperforming the sunbelt and covid boomtowns due to lower supply levels and decent levels of demand. However coastal markets are still overall soft - only SFR is really showing some strength.
Again from Green Street, here is a chart demonstrating the spread. The coastal markets appear to be improving YTD, while sunbelt continues to struggle.
I should clarify that demand in terms of units leased is actually still quite strong in the sunbelt metros, the problem is more that supply is even greater (this is of course a good thing if you are a renter). Given the number of units under construction there should be no relief in 2024, but things ought to get better in 2025 and even more so in 2026 given falling number of starts.
The multifamily REITs continue to trade below private market pricing, in the 6 to 6.5% range, whereas private pricing is more mid to high 5s (weaker markets like the midwest have pushed into the 6s). Here and there even greater discounts can be found.
Stepping back - clearly fundamental performance is going to keep getting worse for much of the sunbelt, with potential NOI declines for sunbelt oriented REITs. However I suspect that even sunbelt multi is at the bottom in terms of pricing, or close to it, as everyone else can see the cresting supply wave and therefore investors will likely be willing to stomach lower yields if they expect future earnings growth.
One potential source of upside in the multi markets is immigration driven population growth. The Census is only recording immigration at 1.1mm based on what I believe is legal immigration data. However the CBO estimates that there were actually more like 3.3mm immigrants in the US last year, many of them illegal.
Here is a chart from John Burns consulting detailing the differences.
I’m not going to get into the politics of this here, but the facts are that even illegal immigrants occupy housing, and if this trend keeps up the extra 2mm people per year could completely offset the supply wave even at a fairly high density of people per unit. For context total vacancy is ~1.6mm units and 2024 deliveries are estimated at 460k units, and it should fall off from there. Even at say 4 people per unit that’s an extra 500k units of demand per year. Certainly something to watch.
Finally I want to touch on the single family rental market or SFR. This market has performed much better than traditional multifamily, and it benefits from significant demographic tailwinds. Further higher mortgage rates likely serve to push people out of home purchases into home rentals more than into apartment rentals.
Here is another chart from Burns on the favorable demos - the prime home buying ages (30s and 40s) are going to see a big increase in population over the next 10 years.
This aging trend alone is going to continue to provide a nice tailwind for the single family housing market, and high rates continue to push some of that growth into rentals instead of purchases.
Blackstone again piling into secular trends here, with their recent purchase of Tricon, a large SFR REIT which was based in Canada but had most of its investments in the US.
All that said, home prices in general feel stretched to me as everything else in CRE has declined except single family, but certainly the NOI growth story here should be pretty good over the next several years, and the demographic tailwind may be enough to keep overall prices afloat despite the huge increase in rates.8
All in all - while multifamily has distress there are some opportunities here as some REITs have oversold and are trading for quite attractive yields. We have taken positions in two smaller apartments REITs that are trading over a 7% cap rate which should I think generate very attractive returns over a 3-5 year hold. We also have taken a position in an SFR firm that is trading a discount to private market value as well. I think multifamily will have another rough year, but has the potential to surprise to the upside with strong population & job growth. Incomes should recover in 25/26, and values will also likely begin their recovery, further boosting NAVs. SFR I expect to post healthy income growth over the next several years again based on strong demographic tailwinds.
We’ll end with residential as this letter is running long. I will send out the remaining sectors soon. If you have any thoughts on splitting this up, either good or bad, I’m all ears! It is an experiment as I said, and if folks hate it I can switch back to one long letter.
On average - again as I have said this is going to vary a lot regionally & by asset class. For example I think lower quality office in poor markets will continue to decline as fundamentals continue to remain weak.
Some of these lenders have securitized certain loans into CLOs, which have property level reporting requirements. Many of the short sellers have used this CLO data to try and extrapolate to the rest of the lender’s portfolios. The issue with this is two fold - first obviously the lender may be putting lower quality deals into a CLO, and holding the best on their balance sheet (or vice versa! Although that makes less sense). The second is less obvious, and that is that the servicer reported loan level property data is actually often not terribly reliable. This is something most people probably aren’t aware of, but I have spent a lot of time in the distressed loan world and I would be very hesitant to rely upon any of the reported high level data. Yes borrowers are supposed to report data and the servicer upload them, but the reality is often much messier than that especially when distress arises.
To really dive into the weeds - this lower reading was assisted somewhat by a really soft legal services reading which may have been noise.
I think you could easily argue the major tech markets suffered a recession during this time frame even if the US as a whole did not.
Anecdotally the NYC market where I live seems to be heating up, as is SF.
The rental market gap is wider due to recent softening of rents in the sunbelt whereas single family home prices have stayed more resilient, so another conceivable outcome here to widen the gap is home prices decline a good bit in the sunbelt metros.
I am being a bit loose here - there are two potential loss scenarios, a recession where demand is destroyed, or another large and rapid spike in rates. I don’t see much evidence of either of those occurring soon though. Of course we will eventually have another recession at some point. And of course if you own RE without good demand, then inflation is just bad news (I’m looking at you midwest office!).
Single family prices are generally determined by single family buyers not the large investors, so its hard for the big SFR owners to see significant home price appreciation without the overall single family market picking up. But they can continue to post strong income growth and likely will. The yields in the SFR sector are generally lower than multi so this makes sense.


congrats re: 2023 series NYC CRE process AND results !